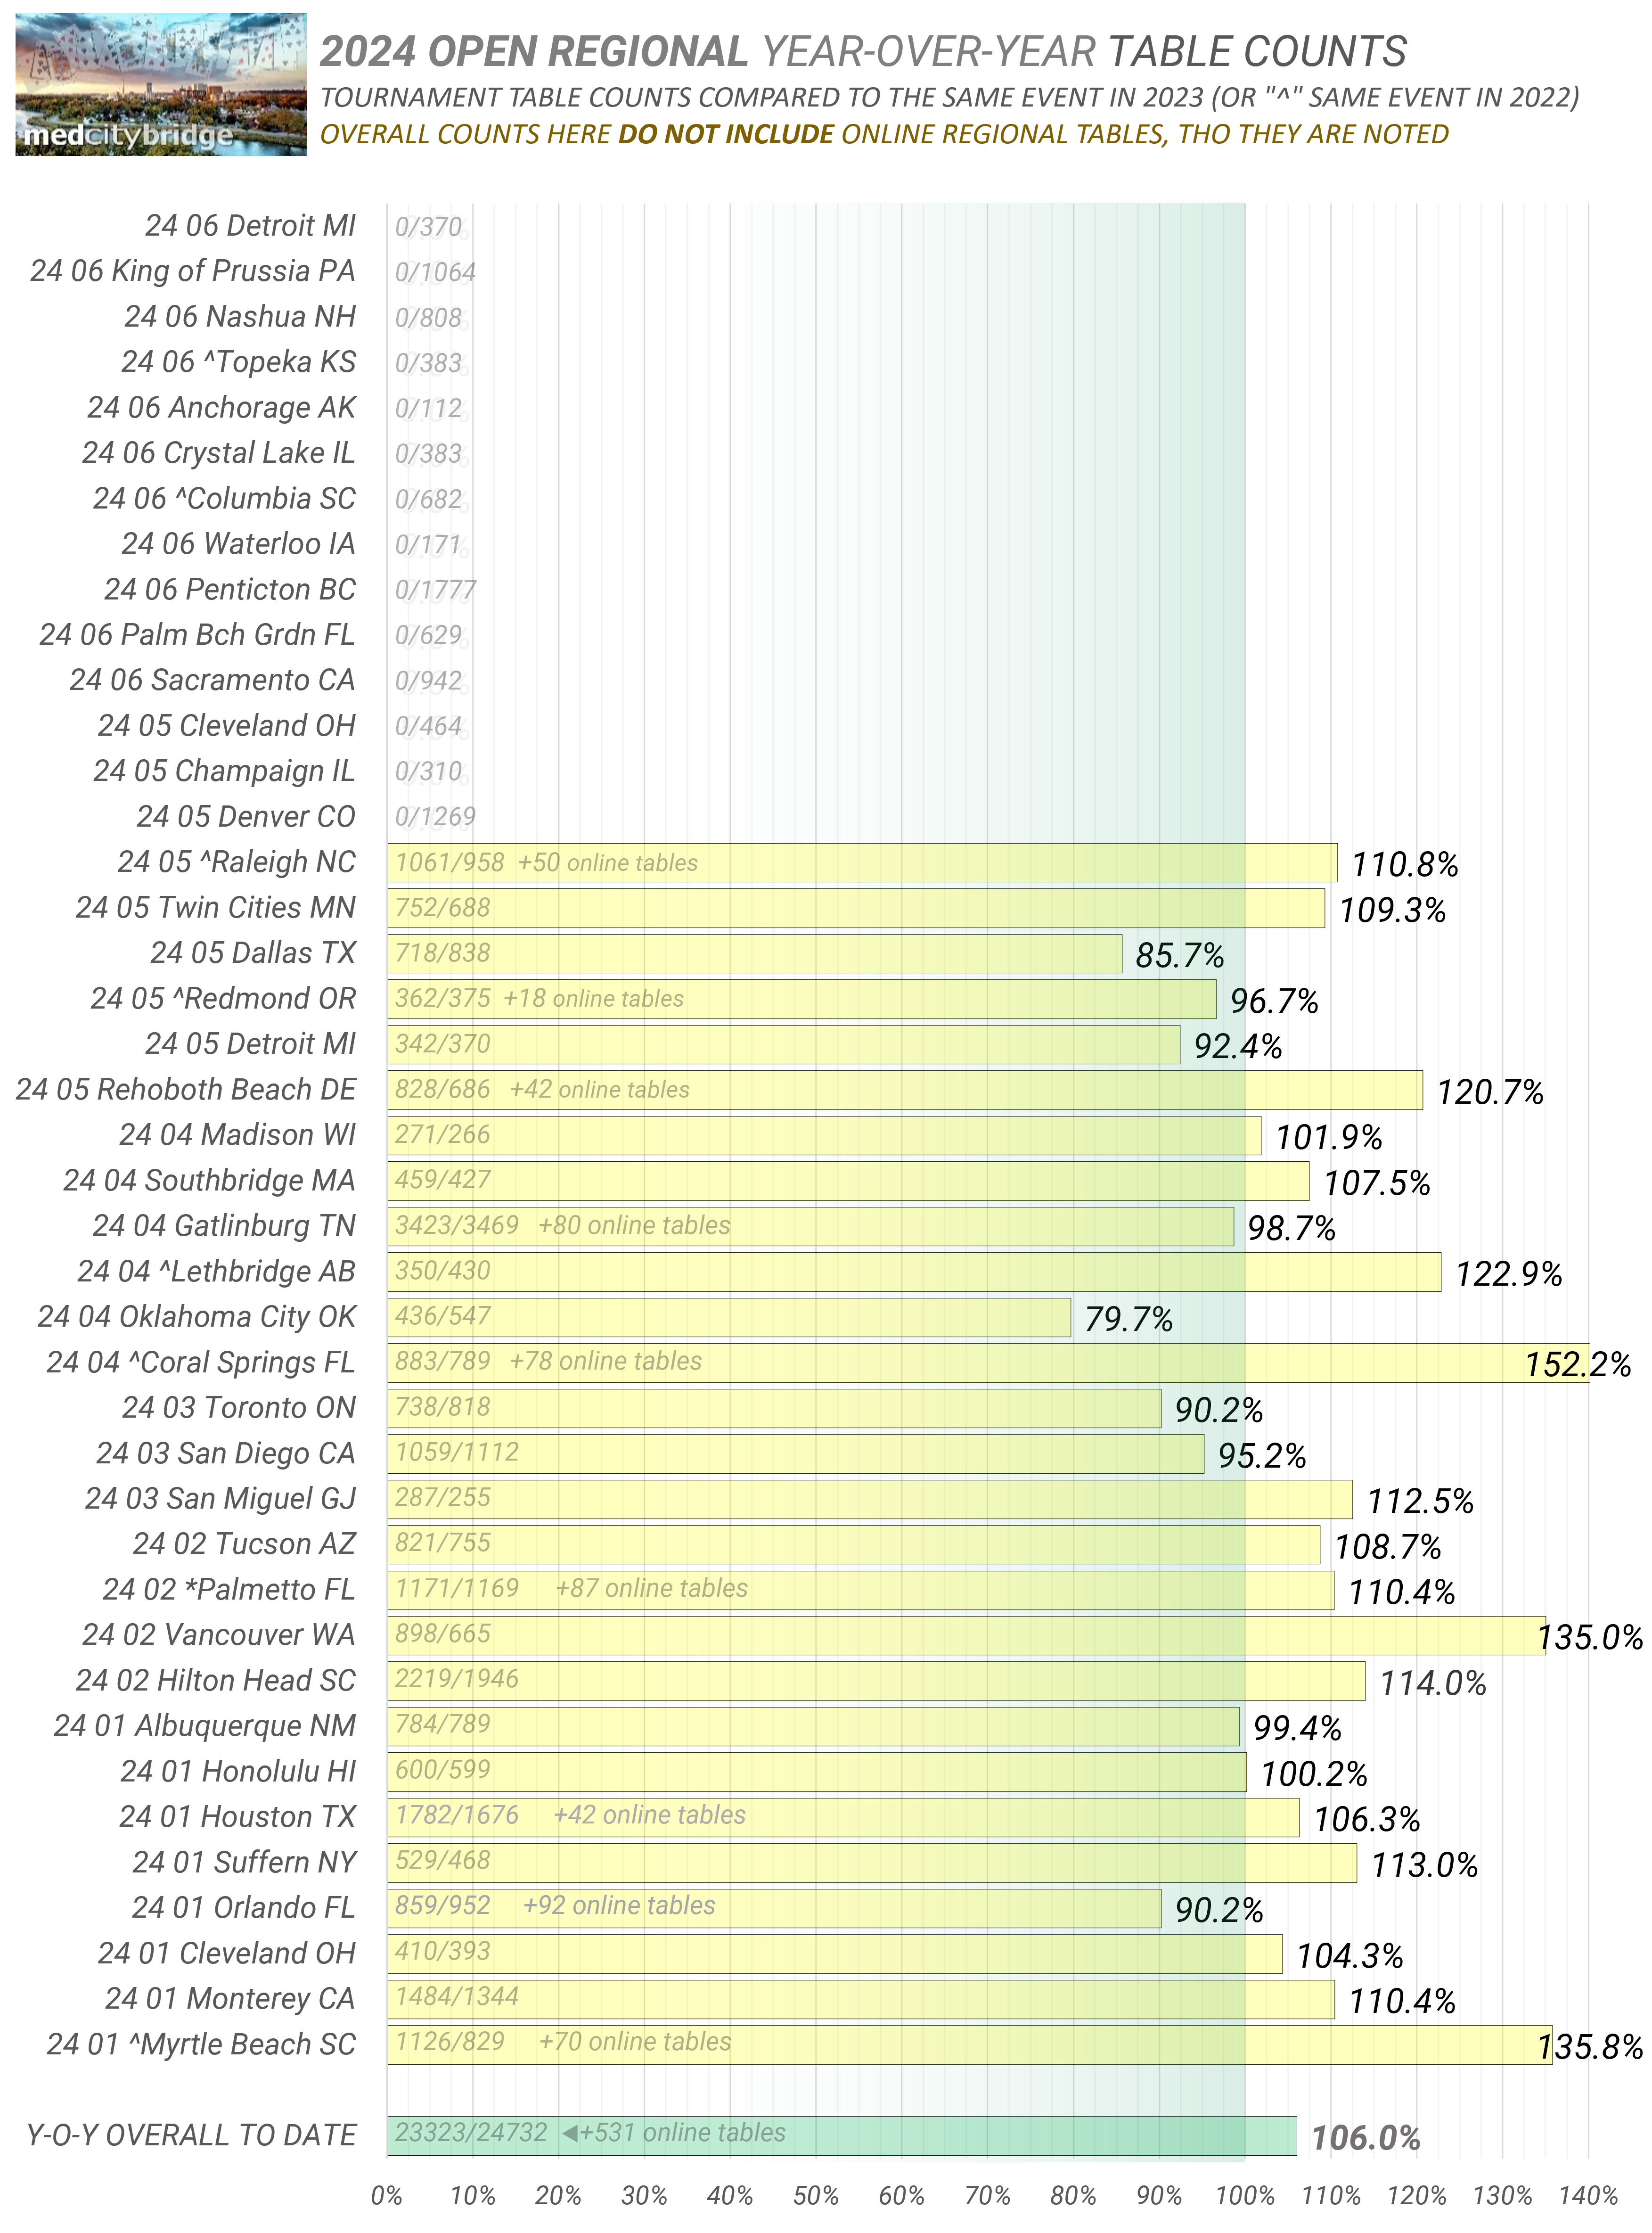
 Open Regionals in the post-COVID world have gotten to the point where you're seeing a second (or third!) of the same tournament since clubs reopened in 2021. Still a few smaller regionals with their first go-around may experiencing table count comparisons to five years ago, but the overwhelming majority of open regionals are back to operating on an annual basis. How are they doing? This chart compares total tables to each same event held one year ago - and tables per day of play in some cases (you've got these tournaments going from seven days to five due to post-COVID 2022 worries, then back to seven as crowds come back, it can get to be really kind of maddening). NOTE that 2024 Regionals which opt to have a District-wide online event during their regional week are seeing far more players than the previous year - and at a much greater rate than those tournaments which do not employ the online option.
Couple of notes about these figures - they're for F2F tables only, so do not include authorized online tables during F2F regionals. (For example, the very first 2024 regional in Myrtle Beach SC has online games scheduled. They won't be added to these totals, but they will be noted here and on each individual tournament chart below.
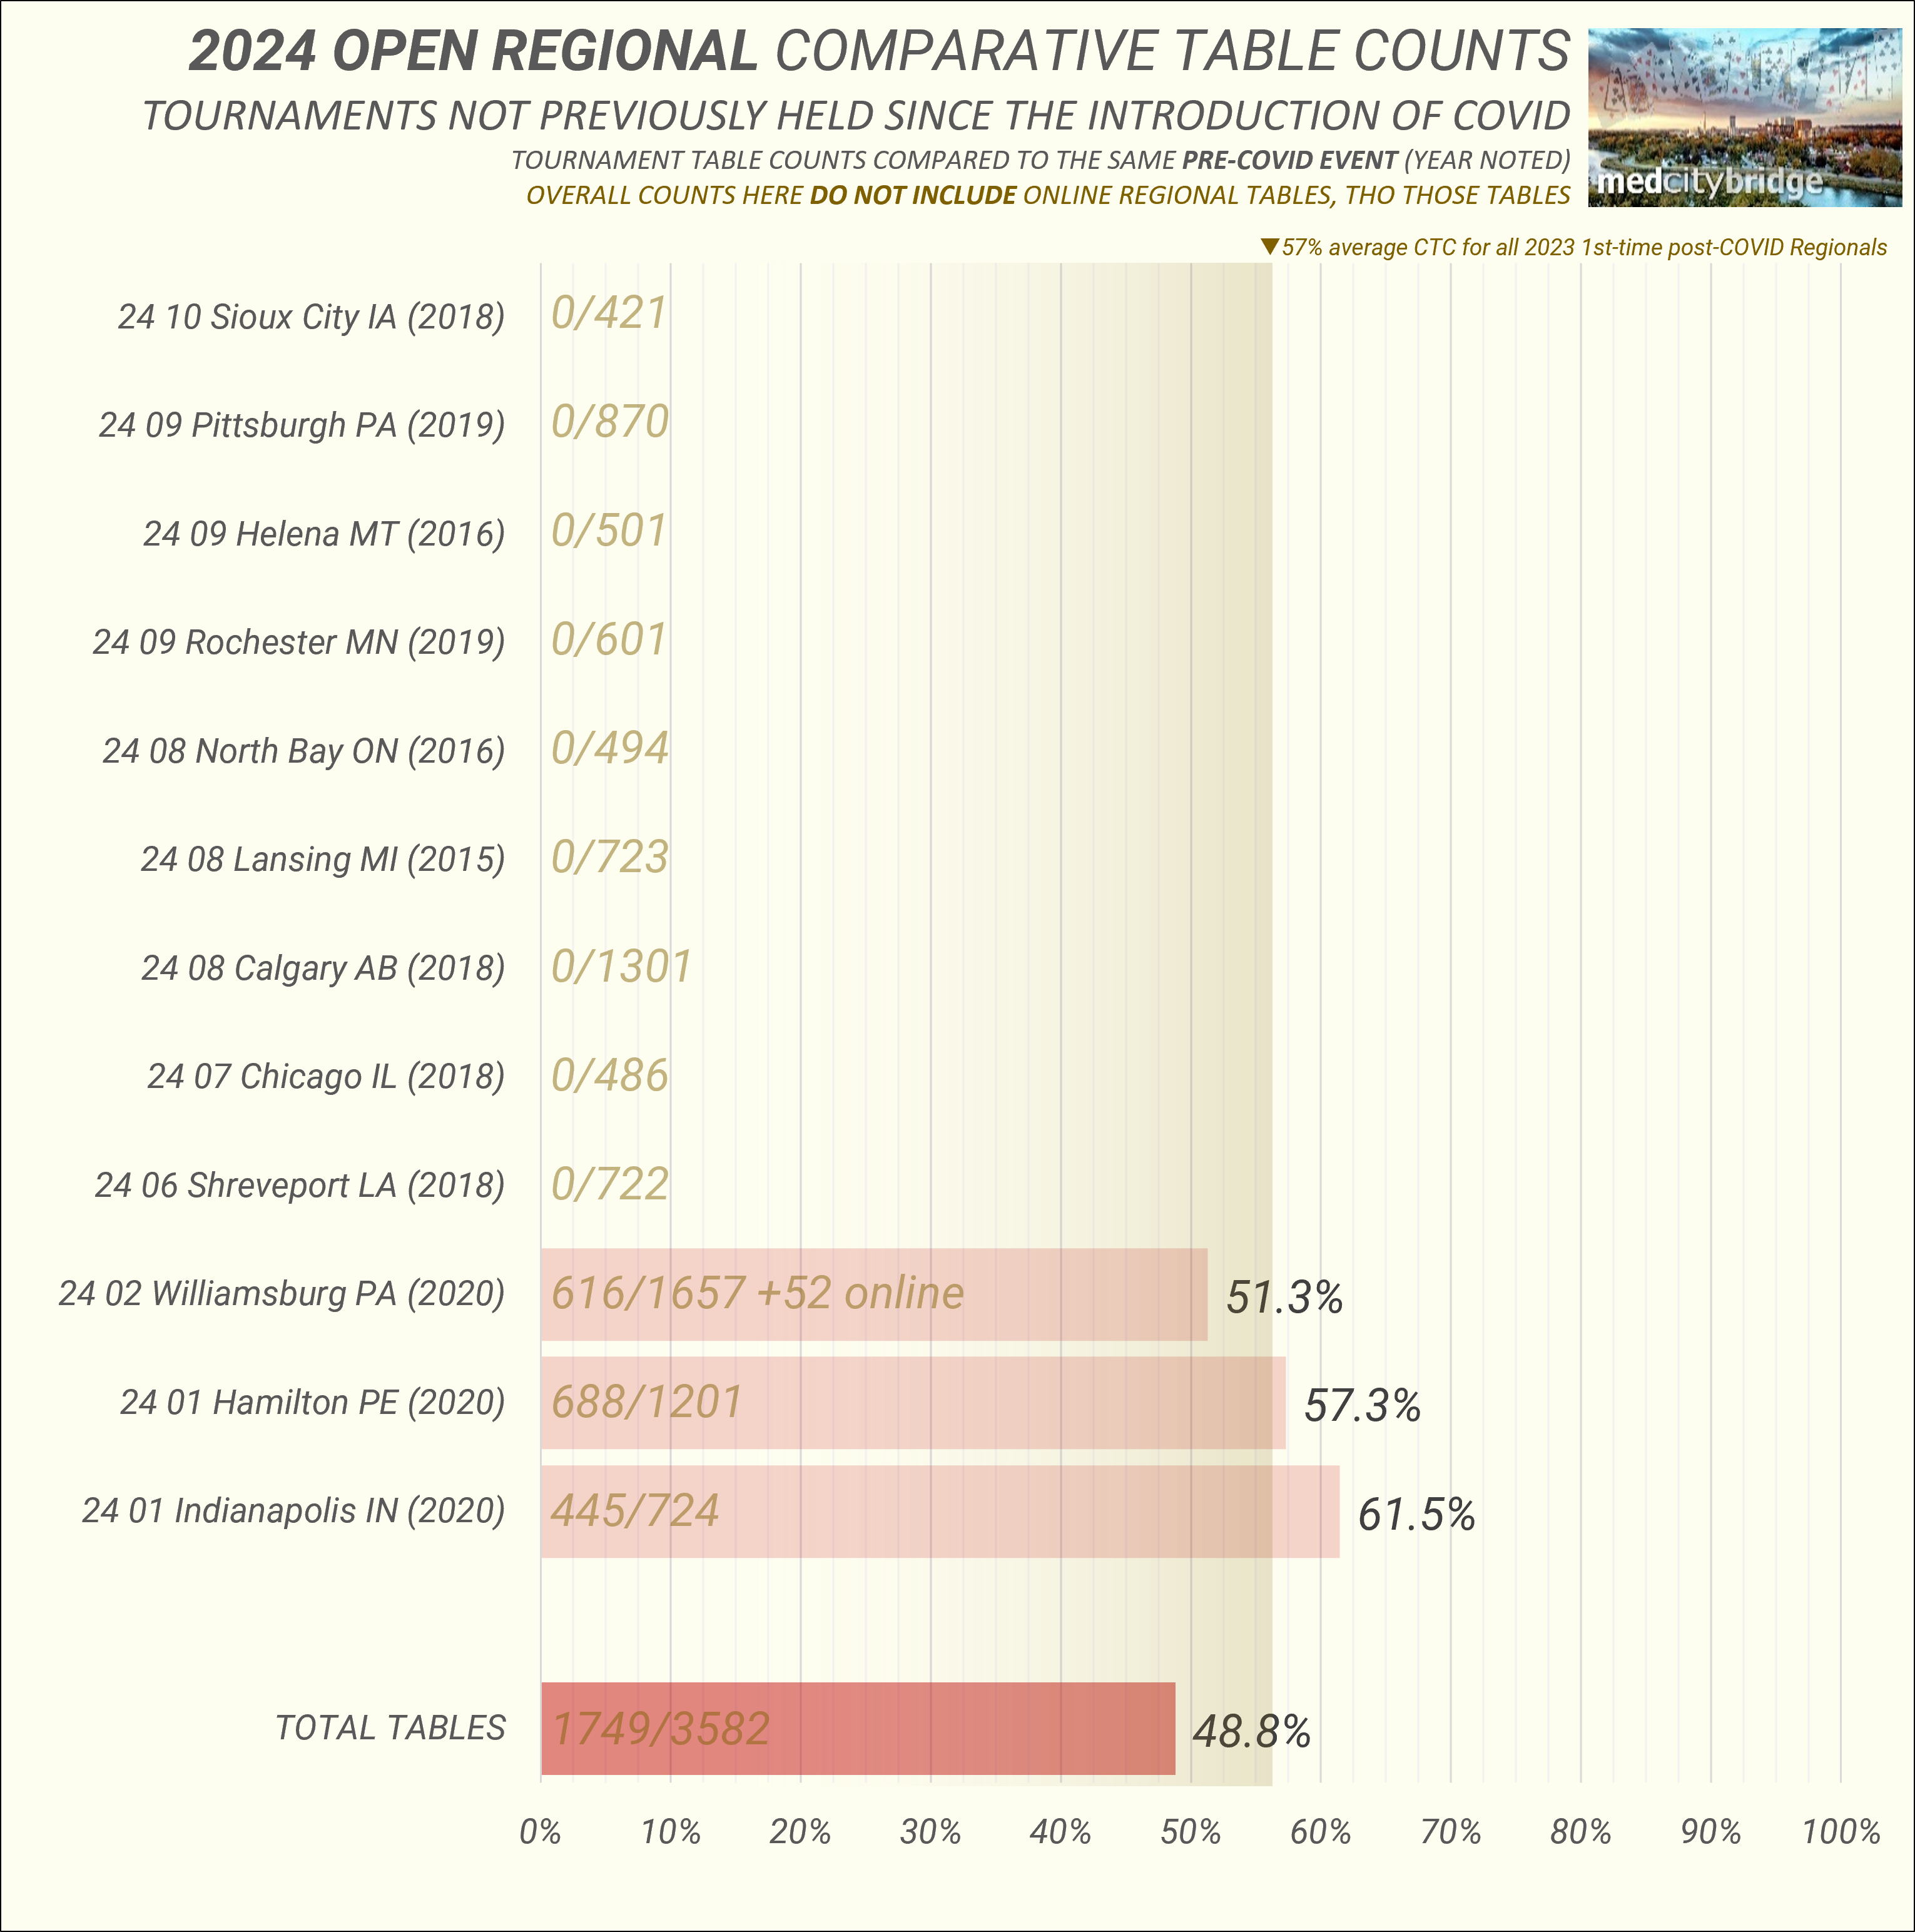
For the few 2024 open regionals that have not been held since the great reopening in 2021, those tournaments are listed just below in the yellow box. Here, they are compared to their pre-COVID events - keeping in mind that the average post-COVID tournament CTC compared to its pre-COVID predecessor was last seen in the 56%-57% range.
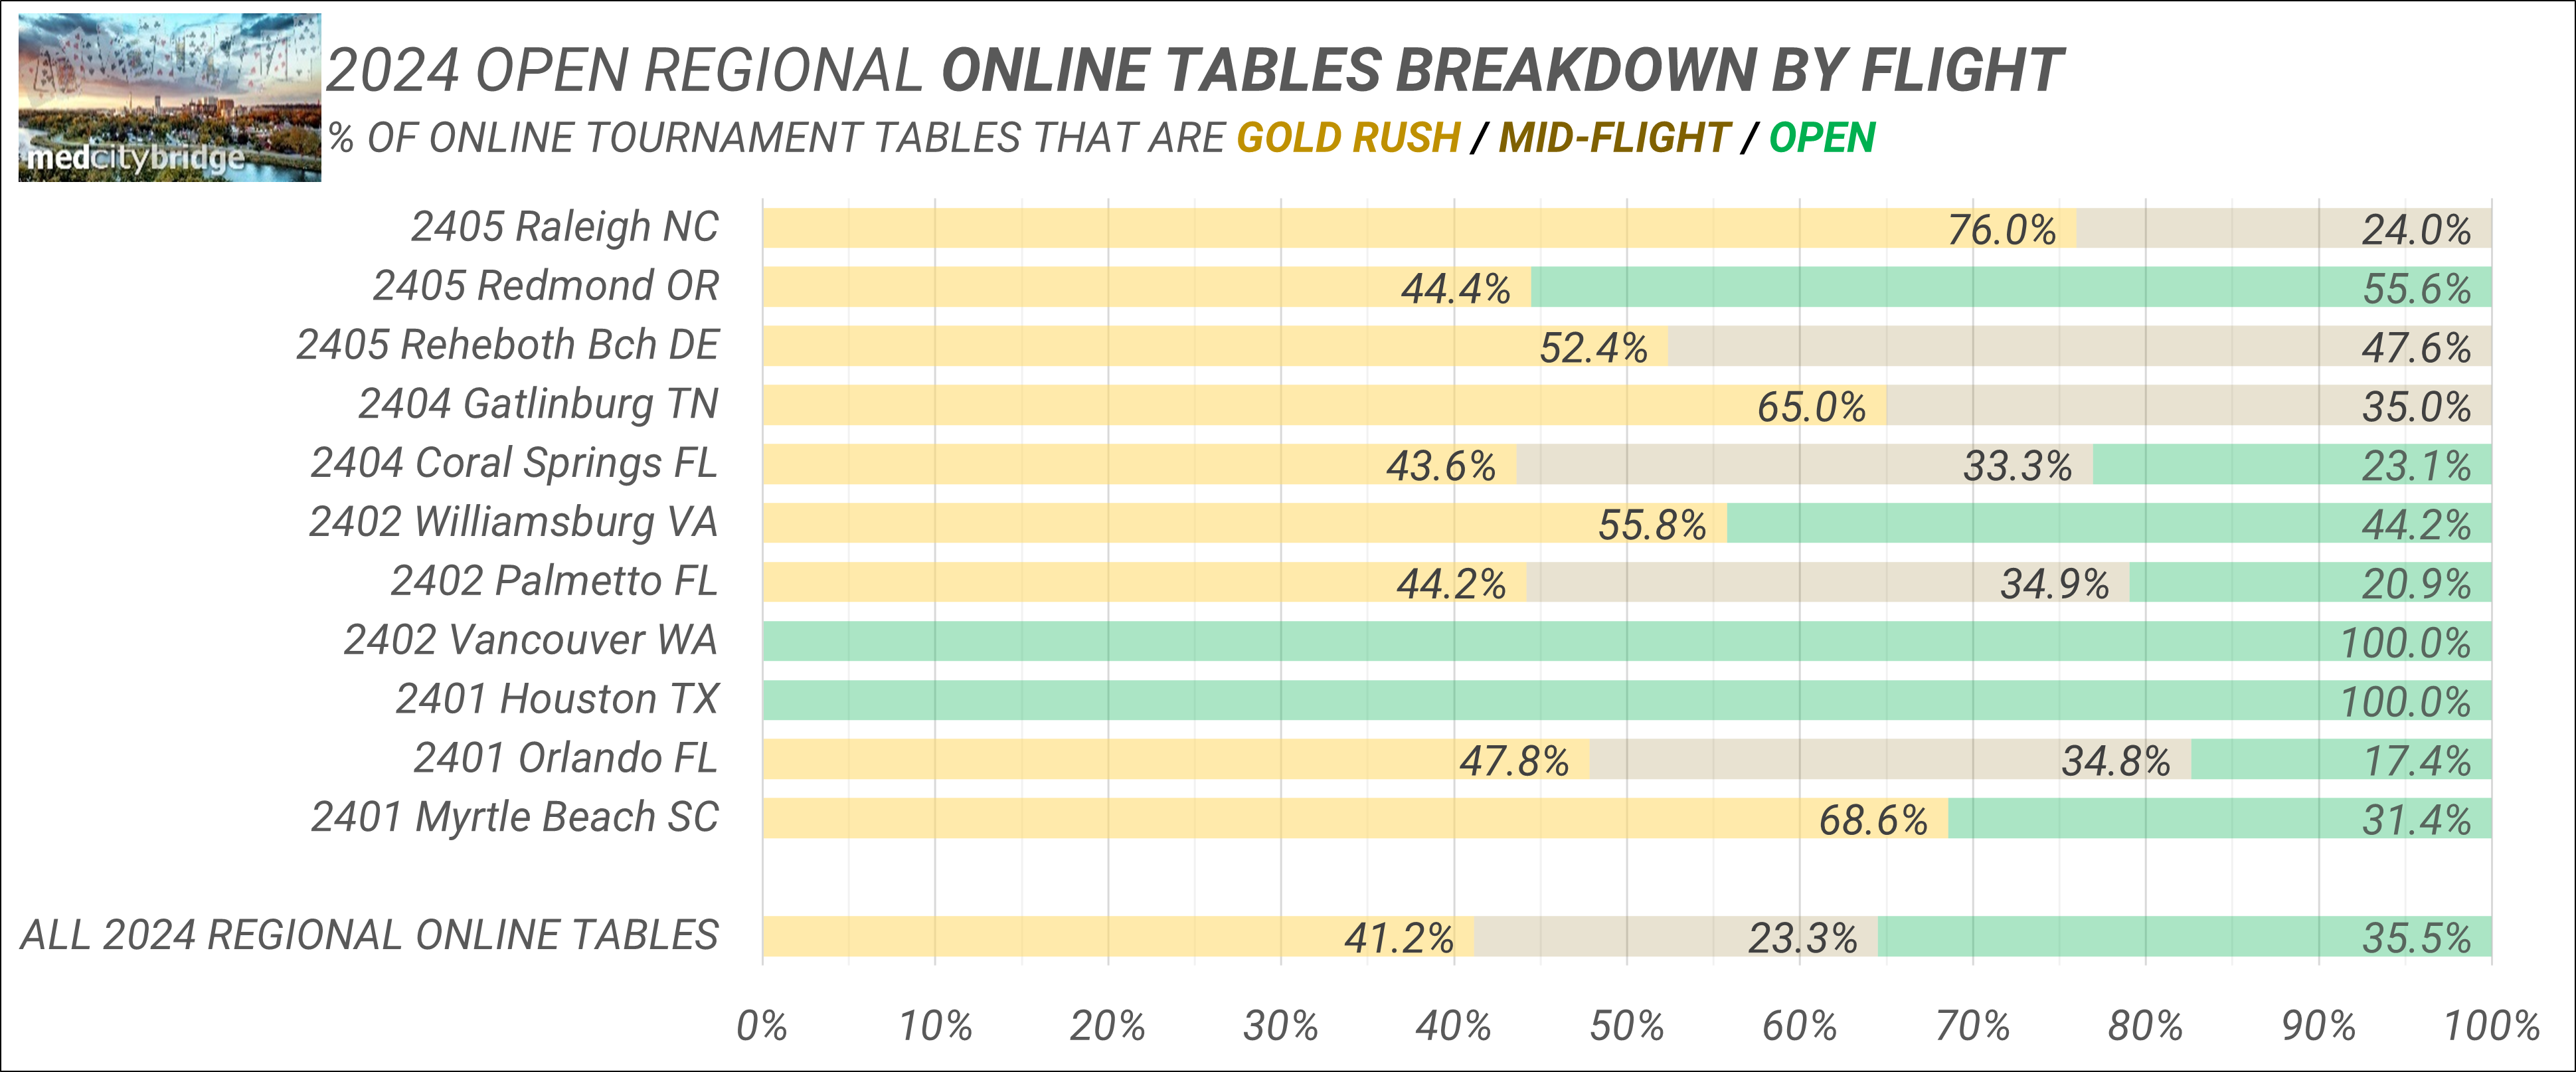
This site is more about face-to-face tables than anything else, so online regional tables generally aren't included in any of the totals - but just in case you're wondering how those online tables break down by flight, almost 2/3rds of the online tables are Gold Rush or Mid-Flight tables:
|


